


An inference result such as “120 tokens per second” is almost meaningless without context. Was it measured for one request or a busy server? Were output tokens counted per user or across the whole batch? What model, precision, prompt length, and GPU configuration produced it?
A useful GPU inference benchmark controls these variables and reports the metrics that match a real service. Its purpose is not to crown a universal winner. It is to find the least costly configuration that satisfies a specific quality, latency, and capacity target.
Define the service objective first
Start with the user experience or batch deadline. An interactive assistant may need a responsive first token and smooth generation. A document-processing queue may tolerate slower individual requests if aggregate throughput is high. Image, speech, embedding, and video models need different units entirely.
For an LLM endpoint, define at least:
- expected input and output token distributions;
- target concurrency and arrival pattern;
- acceptable time to first token;
- inter-token latency or generation rate;
- end-to-end latency percentiles;
- required availability and error rate;
- model, quantization, and output-quality constraints.
These inputs prevent an attractive laboratory number from driving the wrong purchase. A benchmark at batch size one cannot size a service expecting 50 simultaneous conversations.
Use precise inference metrics
Time to first token, or TTFT, measures the interval from a submitted request to the first generated token. It includes queueing and prompt processing in a service-level test. Reporting only model execution time can hide network, routing, scheduling, and cold-start delays.
Time per output token describes the pace after generation begins. Its reciprocal is often presented as output tokens per second for one request. Total system throughput counts output tokens completed across all requests over time. The two numbers differ when continuous batching serves concurrent users.
End-to-end latency spans the complete request. Report percentiles such as p50, p95, and p99 rather than an average alone. Tail latency reveals queue buildup, long prompts, cache pressure, and noisy behavior that a mean can conceal.
Also record request failures, cancellations, queue time, GPU utilization, power if measurable, peak VRAM, and CPU and memory pressure. For non-LLM workloads, replace tokens with a useful output: images, embeddings, frames, audio seconds, or completed samples.
Control the test variables
Fix the model revision, tokenizer, serving engine, container image, framework, driver, and precision. Record tensor-parallel settings, maximum context, batch controls, cache configuration, and any speculative-decoding method. Seemingly small changes can materially alter results.
Use a documented input set. Synthetic prompts make lengths easy to control, but real sanitized traffic better represents language, stopping behavior, and output variation. A sound approach uses both: a reproducible synthetic sweep plus a replay shaped like production.
Specify the complete machine, not just “H100” or another GPU label. Record GPU count, VRAM variant, CPU, system RAM, storage, and interconnect. Clock limits, virtualization, and power settings can matter. Multi-GPU results must explain whether throughput is aggregated or a single model is partitioned across devices.
Warm up before measurement. Initial requests may load weights, compile kernels, allocate caches, and populate file-system pages. Measure cold starts separately if scale-to-zero is part of the intended architecture. Mixing them into a warm steady-state average makes neither behavior clear.
Run a staged GPU inference benchmark
Begin with a correctness gate. Confirm that outputs are structurally valid and that quantization or engine changes meet the application’s quality threshold. A configuration that produces unacceptable results is not a cost optimization.
Next, establish a single-request baseline across several prompt and generation lengths. This isolates prefill and decode behavior. Prefill processes input tokens efficiently in parallel; autoregressive decoding produces tokens sequentially and may stress memory bandwidth differently.
Then run a concurrency sweep, for example one, two, four, eight, and higher simultaneous requests until the service misses its latency objective or reaches a stable capacity ceiling. Maintain each level long enough to avoid drawing conclusions from a brief burst. Use multiple runs and report variation.
Finally, apply a realistic load shape with bursts and uneven lengths. An open-loop generator that sends requests at a planned arrival rate can reveal overload; a closed-loop test that waits for each completion can unintentionally reduce pressure as the service slows. State which method was used.
Avoid common benchmark distortions
Client bottlenecks can make a GPU appear slow. Run enough load generators, check their CPU and network use, and synchronize clocks when components are distributed. Do not let logging or saving every response become the limiting path.
Token counts need consistent definitions. Separate input from output tokens and state whether throughput is per request, per GPU, or system-wide. Exclude padding where appropriate, and use the serving tokenizer rather than estimating tokens from characters.
Watch for queueing. Throughput may continue rising while p99 latency becomes unusable. The sustainable capacity is below the point at which a queue grows without recovering. Likewise, an out-of-memory crash at an aggressive concurrency level should remain in the report, not disappear as a discarded run.
Compare cost per useful output
Hourly price alone cannot show inference economics. For a stable test window, a simple estimate is:
instance cost for the window / successful output tokens or completed requests.
Include startup and idle time when they occur in the intended operating model. A dedicated instance serving steady demand has different idle economics from a serverless endpoint that scales down. Storage, data transfer, load balancing, and operational labor can also affect the final unit cost.
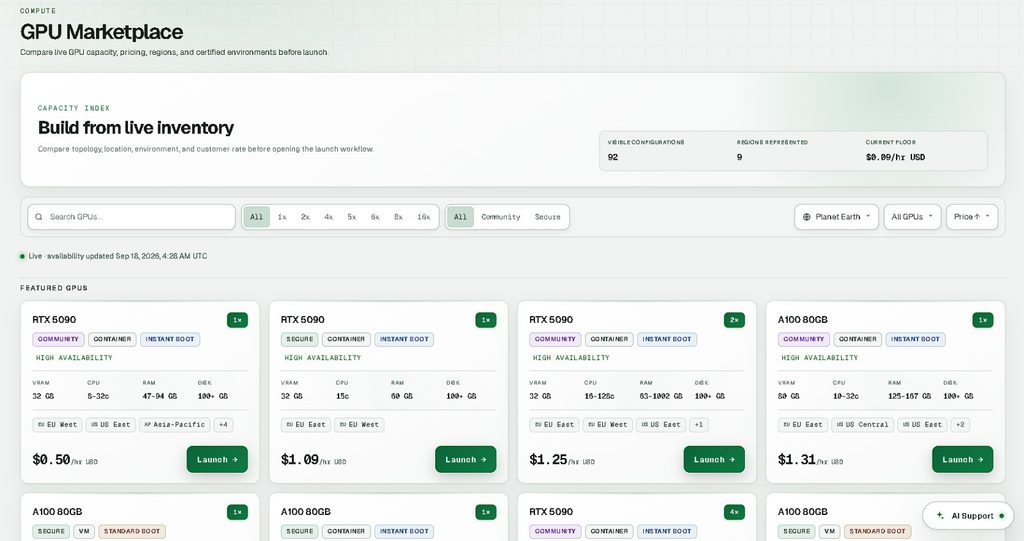
The Hostnot GPU Marketplace at https://hostnotgpu.ae/gpus publishes synchronized complete-machine configurations and current customer-facing hourly rates. Teams can use those listings as test inputs, but they should verify live availability and the exact configuration at deployment. A listed rate is not a benchmark result, and capacity can change.
Present results honestly
A useful report contains the configuration manifest, workload distribution, warm-up method, run duration, repetitions, raw result files, and software versions. Charts should pair throughput with latency, not show either in isolation. Include error rates and confidence ranges or variation across runs.
Do not generalize one model’s result to every workload. Kernel support, attention implementation, quantization, and memory behavior vary. Even two versions of the same serving engine can change the outcome. Re-run the suite after major model, driver, engine, or hardware changes.
Conclusion
A credible GPU inference benchmark connects system behavior to a production objective. It measures first-token responsiveness, generation pace, tail latency, aggregate throughput, memory use, failures, and total cost under controlled and realistic traffic.
Define the workload before testing, publish enough detail to reproduce the run, and select capacity at the point where service targets and cost per useful output meet. That evidence is far more durable than an isolated tokens-per-second claim.